My GIS Projects
Page still work in progress!- Investigating the spatio-temporal patterns of wildfires in California Using ArcGis
- Goal: Find relationship between fire perimeters and bodies of water in Los Angles County
- Datasets Used:
- Wildland-Urban Interface 2020 (Census Block-level WUI data of LA County), Fire Perimeter data, California Counties Population Data, Primary Roads in CA
- Methodology + Analysis:
- Select by Location
- find intersection between” California_Fires_Perimeter” layer and “LA_county” layer → add selected features to new layer on map
- Load shapefiles for California Major Rivers and Creeks and California Major Lakes and Reservoirs
- Add topographic base map and surrounding counties to make chosen county stand out
- Result:
- Fires do fall along various rivers and creeks in LA but mostly around San Gabriel Mountains
- Reasons for these fires near major rivers and reservoirs can be explained through more desert-like terrain in the mountains rather than suburban areas.
- County of LA's fire perimeter between 2012-2022 Using ArcGis
- Goal: Find relationship between fire perimeters and bodies of water in Los Angeles County
- Datasets Used:
- Wildland-Urban Interface 2020 (Census Block-level WUI data of LA County), Fire Perimeter Data, California Counties Population Data, Primary Roads in CA
- Methodology + Analysis:
- First to create a choropleth denoting a population by right clicking counties_LA feature > data > export features. Edit the symbology > primary symbology : graduated colors > field = POP2020.
- Now we want to create the wildfire perimeter layer, just turn on CA_fire_perim layer > change symbology to a different color.
- For blocks designated as WUI for counties look through the attribute table of counties_LA > select by attribute and choose Where WUIFLAG2020 is not equal to 0 so it is selecting all (1=intermix; 2=interface).
- Result:
- Seems that most fires seem to be in mountainous areas where a lot of people don’t reside in or areas with lots of vegetation
- In close zoomed in extent of map, you can see detail of patterning of Wildland-Urban Interface blocks which has to do with the homes that interact with undeveloped wildland vegetation at urban and undeveloped areas.
- We can also see the majority of WUI blocks are more common in areas with undeveloped land.
- Modeling Tiger Habitats Using ArcGis
- Goal: Find portions of protected areas, having the best environment to support tigers
- Datasets Used:
- Boundary, Protect, roads, forest, DEM (76 SRTM 1 Arc-SEcond digital elevation model images within Thailand), Mammals
- Methodology + Analysis:
- Needed to fulfill 5 criterion:
- Suitable habitat cannot be within 1km of a road
- Suitable Habitat area must have following combination of preys:
- 1+ of Sambar or Eld_Deer
- Also must not have more than 1 Gaur
- The roundness of suitable habitat area(s) should be less than 1800. (Roundness = ratio of area to perimeter or area/perimeter)
- Slope of suitable habitat area(s) should be less than 30˚
- GIS Tools Utilized:
- [criterion 1] Buffer tool for each road and erasing the zone from the protected area
- [criterion 2] Select-by-attribute to select only the forest polygons of suitable vegetation types (4 mentioned earlier)
- Intersect tool also used to get the portion vegetation types are suitable in criterion 1 and forest
- [criterion 3]‘Add join` tool to add information in ‘mammals’ table to ‘protect layer’ [since they both share the same unique Protect_ID]
- In new layer select features where sambar or eld_deer is 1 or more
- Use intersect to get only data within criterion 2 and info specified above
- [criterion 4]New column is made ‘Roundness’ and then ‘calculate field’ tool used to select features with roundness less than 1800 → select-by-attribute
- [criterion 5]Mosaic Dataset and add necessary rasters to it → generate slope with slope tool → extract cells w/ slope value less than 30 with Raster Calculator → convert raster to polygon → intersect tool with criterion 4 and selected slope polygons
- Result:
- 25 features meet all 5 criteria. Tigers are found in mixed deciduous forests out of any forests in Thailand due to resources that forests provide which can’t be found anywhere else.
- Trade and Service Area Analysis of Santa Maria County Gas Stations Using ArcGis
- Goal: Find equal competition trade areas for gas stations in santa barbara
- Datasets Used:
- SMC Census Block 2010
- Gas Station Location Coordinates
- Methodology + Analysis:
- Use network analyst tool to perform service area analysis based on distance
- Outline the trade areas
- Load shapefiles for California Major Rivers and Creeks and California Major Lakes and Reservoirs
- Add topographic base map and surrounding counties to make chosen county stand out
- Result:
- polygons that outline that equal competition trade areas
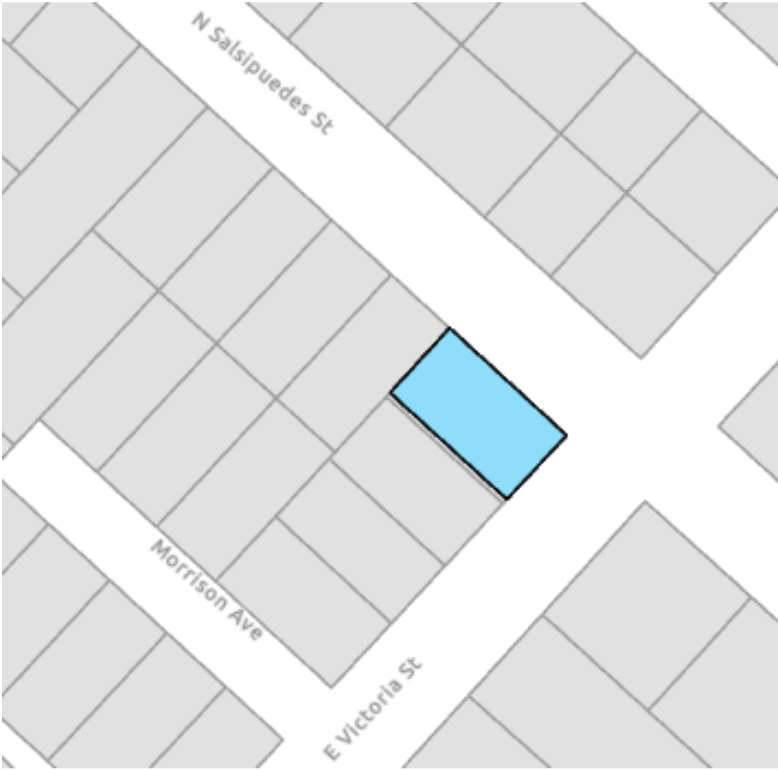
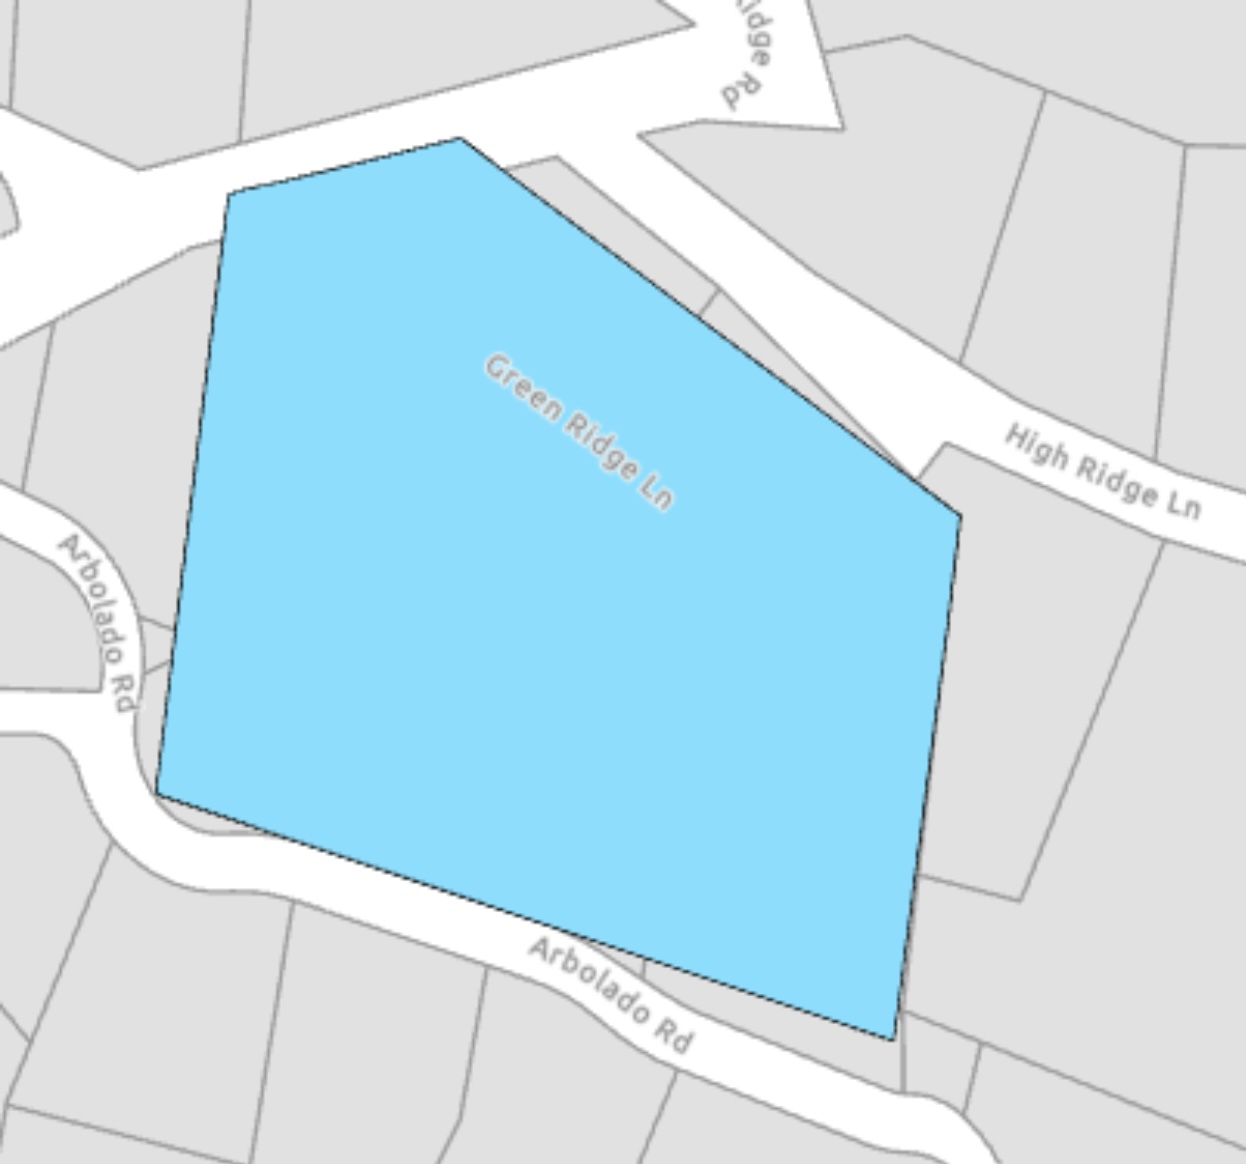
- Work with the County of Santa Barbara Surveyor Office Using ArcGis
- Objective: generate shapefiles of indexing polygons, by using techniques that involve tracing the assessor's parcel polygons,
and/or coordinate geometry input registered to the assessor’s parcel polygon basemap. - Datasets Used:
- Methodology + Analysis:
- STEPS TO GEOREFERENCE MAP PARCEL
- locate map parcel from excel sheet on surveyor website
- Make sure the data on pdf map matches the excel sheet description
- Find what street intersection and locate it on the map using *select by attribute*
- Measure and make sure it matches the measurements on ArcGIS [feet]
- Now trace and fill polygons for parcels. [edit > create > polygon]
- When done, merge [merge > hit merge on bottom right]
- Make sure to press save in the ribbon and save work and relabel parcel
- Result:
- These indexing polygons will be used for joining tabular index information about the recorded map it references with a hyperlink to the scanned PDF of the recorded map available online
- These indexing polygons are then used to improve the completeness of geospatial indexing systems currently in use at the county.
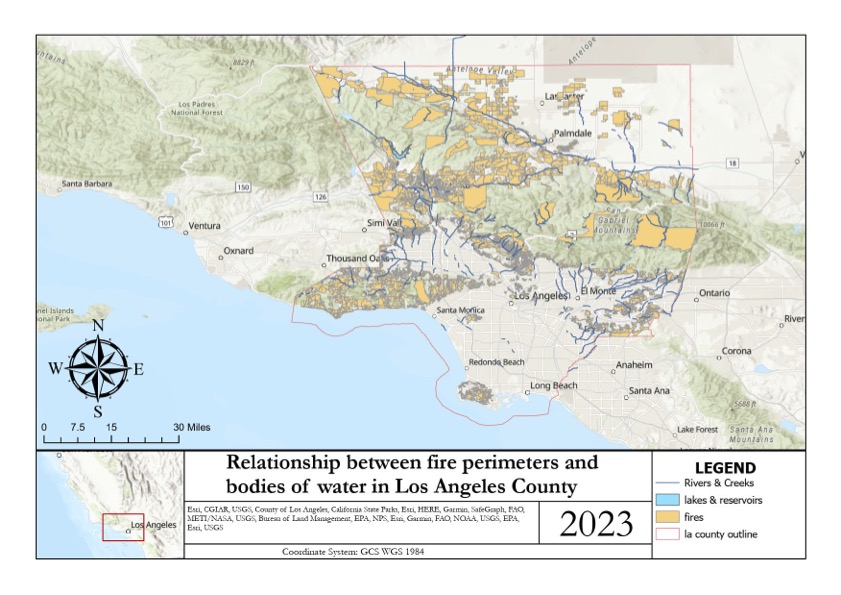
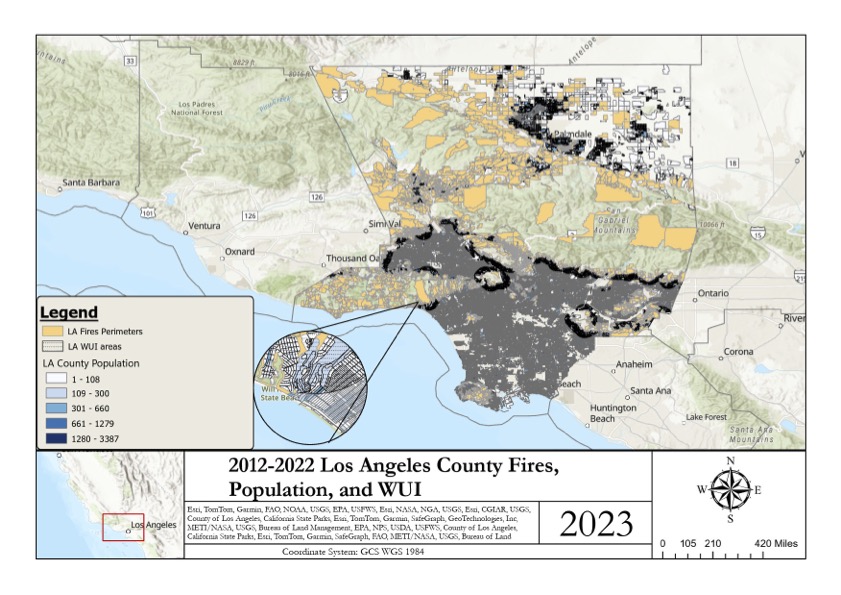
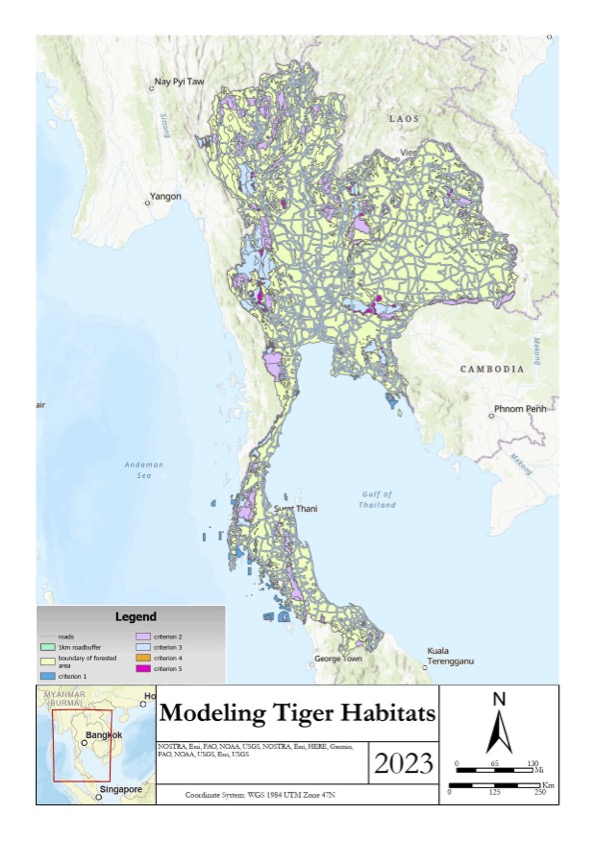
Figure 4.1: Service Area Analysis: Station 21 (Santa Maria)
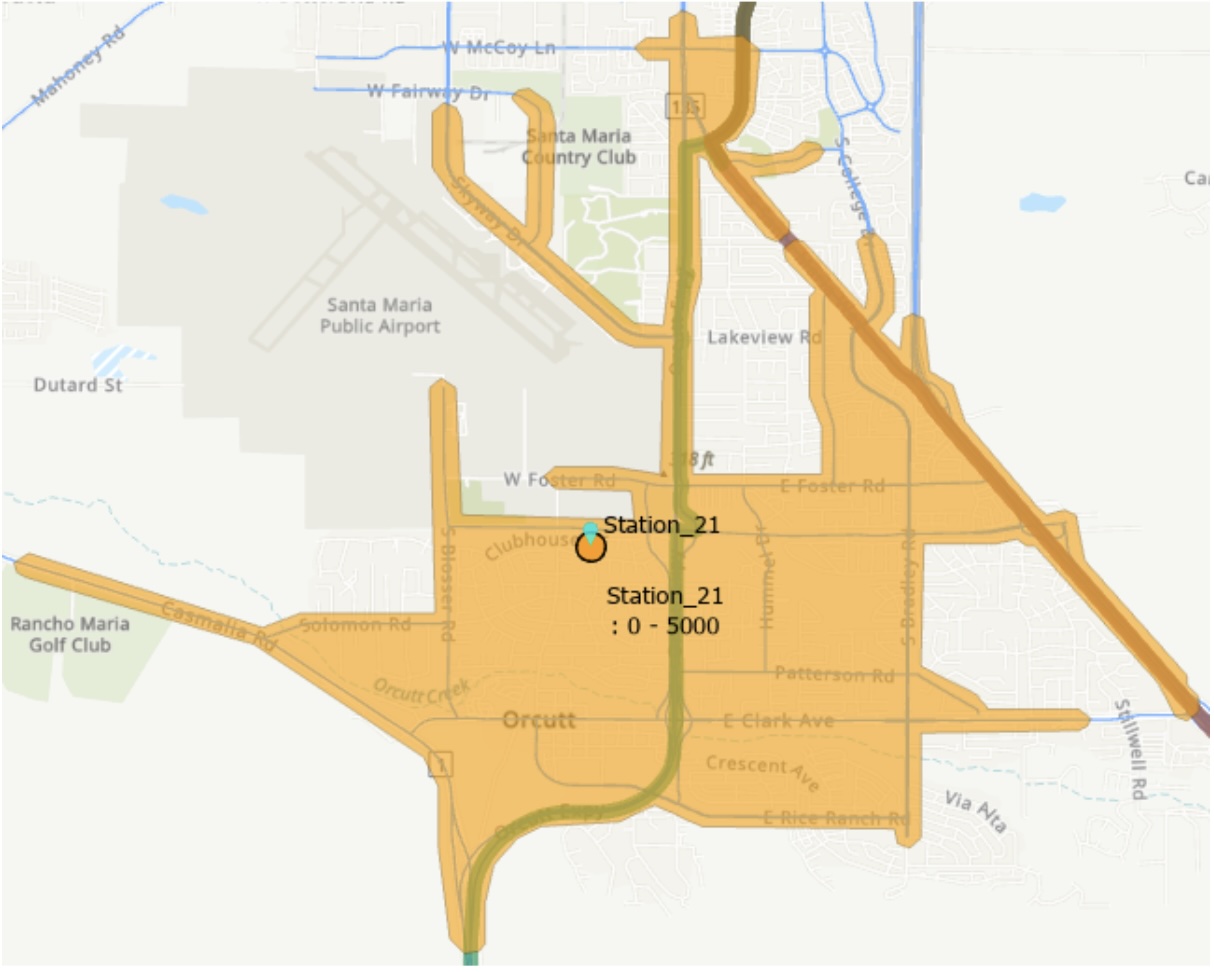
consideration of a radius of 5000 meters. Also, Station 21 is located around Santa Maria.
Figure 4.2: Network Analysis of Santa Maria to Santa Barbara
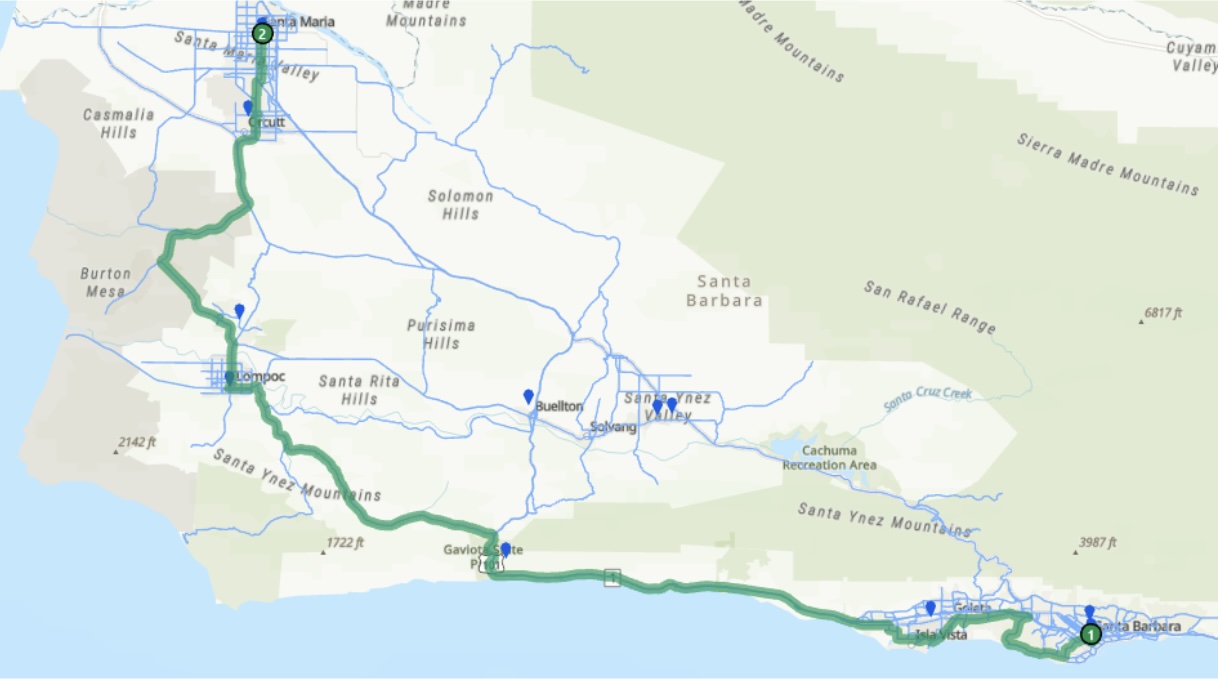
with respect to time, minimizing the time of travel. Location 1 depicts Santa Barbara and location
2 depicts Santa Maria.
Figure 4.3: Network Analysis of Santa Maria to Santa Barbara but with barriers
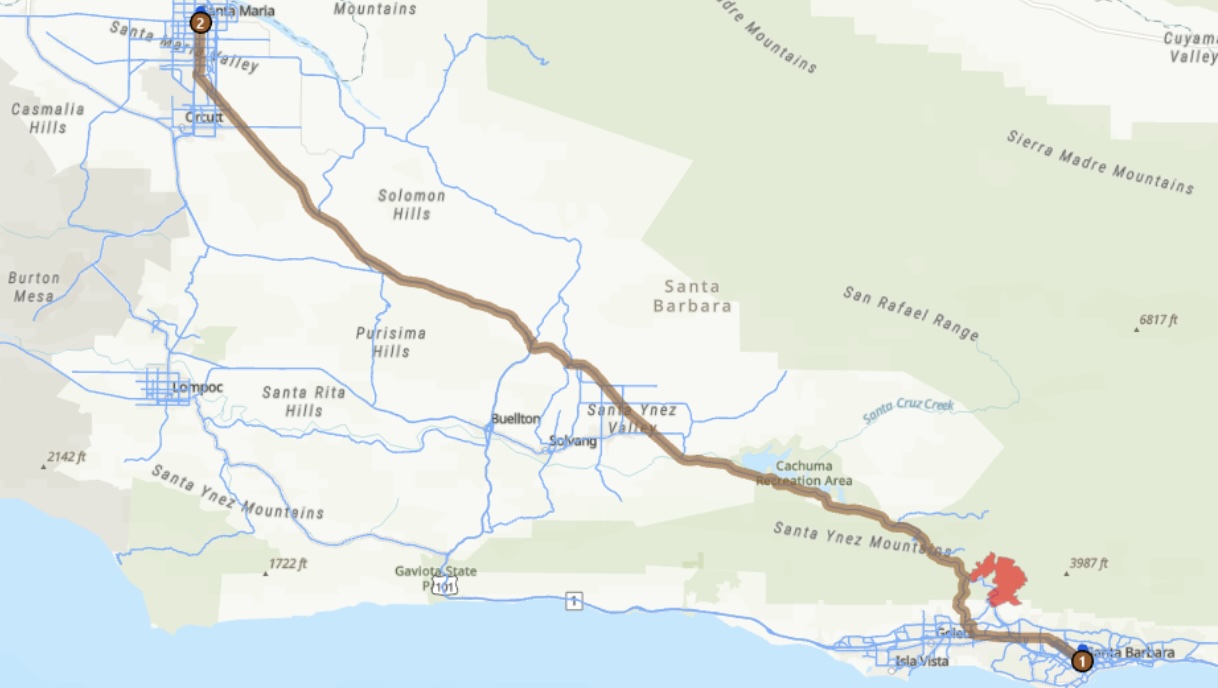
with the presence of a wildfire. There is a detour because I also included a barrier of the CAVE
wildfire boundary so that it knows to take another route if it crosses that fire boundary.
Parcel 1: R013/001
Parcel 2: R013/009
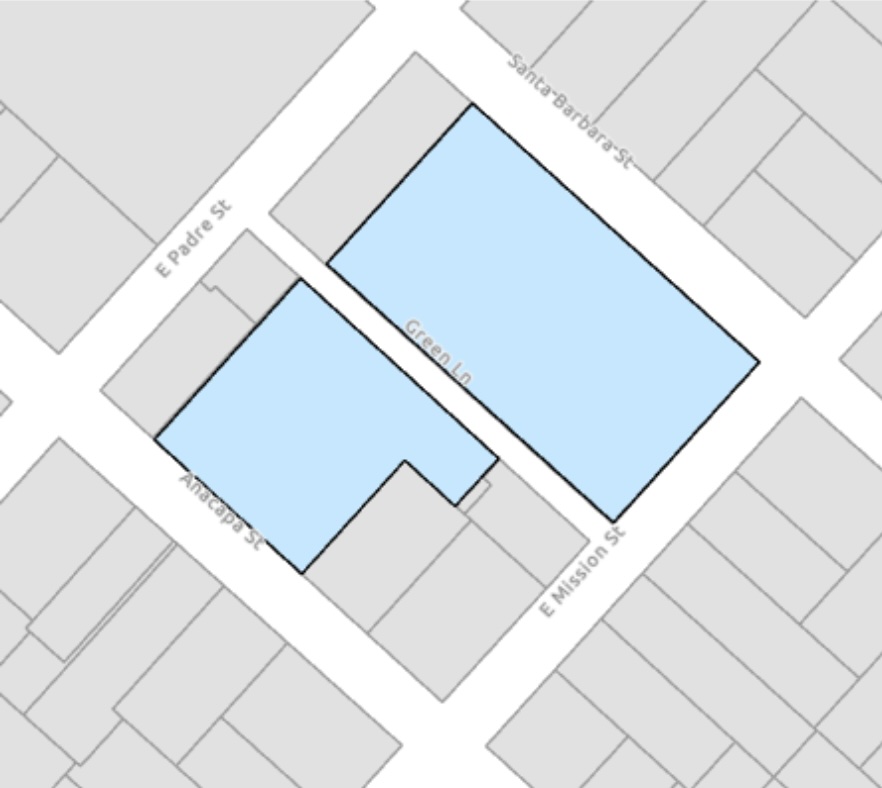
Parcel 3: R013/004DR